
A research results section is built from evidence that has already been collected and analyzed. Its language can be improved, but its numbers, categories, relationships, and uncertainty are not stylistic material. They are the findings.
That makes a results section humanizer useful only inside a controlled workflow. The aim is to remove repetitive sentence patterns and improve the order of explanation without changing a value, reversing a comparison, strengthening a conclusion, or disconnecting the prose from its table or figure.
This guide explains how to humanize research results while keeping every sentence traceable to the analysis that supports it.
Does a results section need humanization?
Not every results section needs a substantial rewrite. Statistical reporting has legitimate reasons to sound consistent. Repeated variable names, parallel comparisons, and standardized notation often improve accuracy.
Humanization is most useful when the surrounding prose has clear language problems:
- Every paragraph begins with “The results showed that”
- Tables are repeated sentence by sentence without a clear reading order
- Transitions are mechanical or unrelated to the analytical logic
- Long sentences combine several findings that should be separated
- Qualitative themes are described with generic filler
- The section alternates awkwardly between data reporting and interpretation
Do not change conventional statistical notation merely to make it look less predictable. A concise, standardized sentence is preferable to a varied sentence that obscures the analysis.
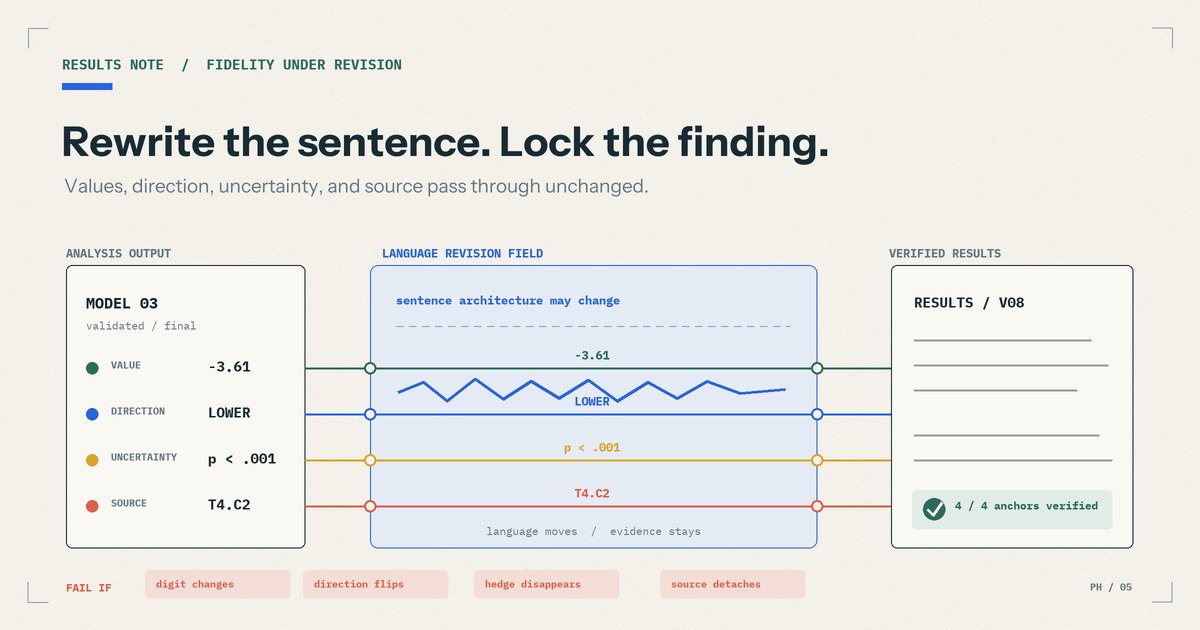
Language may change only while every reported value remains connected to its analysis output.
What must remain unchanged in research results
Build a protected-results sheet before revising. Use the analysis output, validated dataset, approved tables, figure files, coding framework, or audit trail as the source of truth.
| Result element | Details to preserve |
|---|---|
| Descriptive statistics | Sample size, mean, median, spread, range, percentage, unit |
| Inferential statistics | Test name, statistic, degrees of freedom, p-value, interval, effect size |
| Direction and magnitude | Increase or decrease, positive or negative, stronger or weaker |
| Group relationships | Reference group, comparison group, ordering, interaction |
| Table and figure links | Number, panel, column, row, note, and the finding being referenced |
| Qualitative findings | Theme names, prevalence language, participant meaning, negative cases |
| Null or uncertain findings | Non-significance, uncertainty, inconsistency, missing evidence |
Preserve formatting distinctions that carry meaning. p = .04 is not the same as p < .04; a 95% confidence interval is not interchangeable with a standard deviation; an adjusted model is not the same as an unadjusted comparison.
How to humanize a results section step by step
1. Reconcile the prose with the analysis first
Before improving style, confirm that the existing results text is accurate. Compare each reported value with the source output and each table reference with the final table.
Check for:
- Values copied from an earlier analysis version
- Sample sizes that differ after exclusions or missing data
- Percentages calculated with inconsistent denominators
- Table numbers changed during document editing
- Confidence intervals or signs entered incorrectly
- Qualitative theme names that no longer match the final coding framework
A humanizer cannot determine which of two conflicting values is correct. Resolve discrepancies before revision.
2. Keep structured results outside the editor
Do not humanize raw tables, equations, figure labels, statistical output, code, or data extracts. Revise only the prose that guides the reader through those materials.
Keep table and figure callouts inside the sentence when they establish provenance, such as “Figure 2 shows...” or “As reported in Table 4...”. Then verify their numbers and positions after the rewrite.
If the paper was uploaded as a PDF, use the PDF humanization workflow to correct extraction errors before handling statistical text.
3. Classify what each sentence is doing
Results prose usually performs one of four functions:
- Orient: identify the analysis, outcome, or display
- Report: state the numerical or qualitative finding
- Compare: show a relationship between groups, conditions, or themes
- Summarize: identify the pattern across several findings without explaining why it occurred
Mark these functions in the draft. A paragraph becomes easier to revise when its information order is explicit. Interpretation, recommendations, and explanations of mechanism usually belong in the discussion section, not in results.
4. Process one analytical unit at a time
Paste one result paragraph or a small group of sentences about the same analysis into PaperHumanizer. Keep the relevant table or output open beside the editor.
Choose Technical / STEM tone for quantitative, experimental, computational, medical, and engineering results. It prioritizes precise reporting and established terminology. Standard Academic can suit straightforward descriptive prose. Qualitative results may use Scholarly tone when the section requires nuanced theme relationships, but exact theme labels and participant meaning must stay fixed.
Use Standard humanization when the prose only needs lighter flow improvements. A broader Deep rewrite, when available, requires a stricter audit because more sentence structure may change. The academic tone guide explains the tradeoffs.
5. Trace each revised claim back to its evidence
Use Compare view to check the original and revised paragraph sentence by sentence. Every sentence should point back to an identifiable source: one table cell, figure pattern, model coefficient, test output, or coded theme.
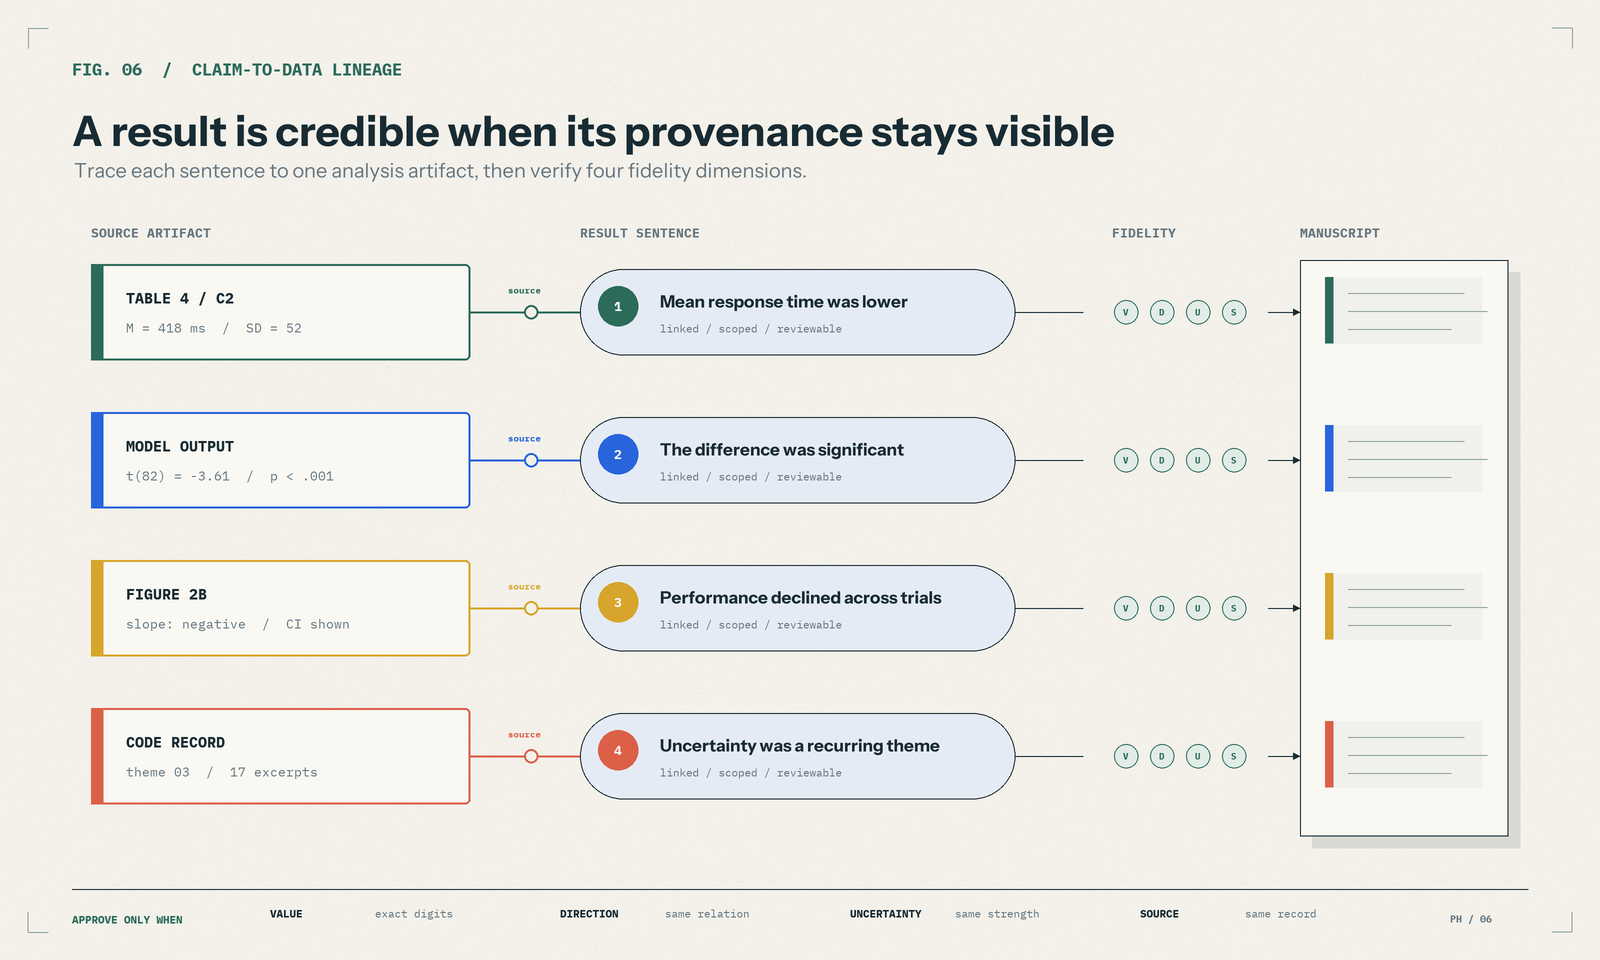
Approve a sentence only when its values, direction, uncertainty, and source can all be traced.
For quantitative findings, verify:
- Every digit, sign, decimal place, and unit
- Test statistic and degrees of freedom
- Exact p-value or threshold notation
- Confidence or credible interval bounds
- Effect size and reference category
- Whether the result is adjusted or unadjusted
- Whether significance and practical importance remain distinct
For qualitative findings, verify:
- Theme and subtheme names
- Which participants or sources support the theme
- Whether frequency language is justified
- Contradictory or negative cases
- Quotations and participant identifiers
- The boundary between participant meaning and researcher interpretation
6. Check alignment across the paper
A revised results section must remain consistent with the methods, tables, figures, abstract, discussion, and conclusion.
Pay particular attention to:
- Sample size versus the participant flow reported in methods
- Outcome names versus the instrument definitions
- Model specification versus the statistical analysis plan
- Results highlighted in the abstract
- Interpretations and limitations discussed later
The methodology section workflow provides a matching audit for sample, measures, procedure, and analysis details.
7. Restore the reporting conventions of the field
After the automated pass, restore any required journal style, statistical format, abbreviations, tense, heading pattern, and disciplinary terminology. Humanization should not override a reporting guideline or journal instruction.
If a field expects a compact formulaic statement, retain it. Variation is useful only when it improves comprehension without weakening reproducibility.
Before and after: revise rhythm without changing statistics
Mechanical draft
The results showed that the intervention group had a lower mean response time than the control group (M = 418 ms, SD = 52 vs. M = 463 ms, SD = 61). Furthermore, the results showed that this difference was statistically significant, t(82) = -3.61, p < .001, d = 0.79. Additionally, the results showed that accuracy did not differ significantly between groups, p = .38.
Controlled revision
Mean response time was lower in the intervention group (M = 418 ms, SD = 52) than in the control group (M = 463 ms, SD = 61). The difference was statistically significant, t(82) = -3.61, p < .001, d = 0.79. Accuracy did not differ significantly between groups (p = .38).
The revision removes repeated framing and improves the comparison order. It preserves both group values, the direction and significance of the difference, degrees of freedom, effect size, and the non-significant accuracy result. It does not explain why the intervention worked; that belongs in discussion.
Special cases in results-section humanization
Null findings
Do not rewrite “no statistically significant difference was observed” as “the groups were the same.” A non-significant test does not prove equivalence unless the study used an appropriate equivalence framework.
Multiple models
Keep model numbers, adjustment sets, reference categories, and outcome definitions visible. Do not merge estimates from different models into one smooth narrative.
Subgroup and exploratory analyses
Preserve labels such as exploratory, post hoc, sensitivity, or subgroup. A stylistic rewrite must not make a secondary analysis sound preregistered or confirmatory.
Qualitative quotations
Keep direct quotations outside the humanization pass. Revise the analytical framing around them, then restore the exact quotation, punctuation, and participant identifier.
Tables with many outcomes
Do not narrate every cell. Use prose to identify the pattern most relevant to the research question, while ensuring that the selection does not hide contradictory results.
Common results-rewrite errors
Stop and restore the source if a revision:
- Changes, rounds, or drops a value
- Reverses the reference and comparison groups
- Replaces “associated with” with “caused”
- Treats a non-significant result as proof of no effect
- Removes uncertainty or an unexpected finding
- Adds an explanation not tested by the analysis
- Confuses standard deviation, standard error, and confidence interval
- Changes a qualitative theme name or its prevalence
- Moves a table or figure citation to the wrong claim
These are evidence errors, not style preferences.
Final results-section checklist
- Every sentence matches the final analysis output
- All numbers, signs, units, and decimal places are exact
- Group direction and reference categories are unchanged
- Null, uncertain, and contradictory findings remain visible
- Tables and figures support the sentences that cite them
- No mechanism or causal explanation was added to results
- Qualitative themes and quotations match the audit trail
- Results remain consistent with methods, abstract, and discussion
- Journal reporting conventions have been restored
- A coauthor or analyst reviewed high-risk changes when required
Frequently asked questions
Can I use an AI humanizer for a research results section?
Yes, when the applicable policy permits language editing and the output is verified against the analysis. Use it for prose organization and sentence flow, not for modifying tables, statistical output, or findings.
Which tone is best for statistical results?
Technical / STEM is generally the best fit because it favors precise, measurement-focused reporting. Standard Academic can work for simpler descriptive results.
How do I make a results section sound less repetitive?
Organize each paragraph around an analytical question, vary sentence openings, combine closely related values, and use transitions based on comparison or sequence. Keep repeated variable and measure names when precision requires them.
Can a humanizer change p-values or sample sizes?
Any automated rewrite can make an unwanted change, so verification is mandatory. Compare every value with the source output and restore discrepancies before submission.
Should I humanize tables and figures?
No. Keep structured data, equations, labels, and captions outside the language-revision pass unless you are manually editing a caption with the display open beside you.
How is humanizing results different from humanizing discussion?
Results report what the analysis found. Discussion interprets what those findings mean, how they relate to prior research, and where their limits lie. Process and audit the sections separately.
When the analysis and protected-results sheet are ready, open the research paper humanizer and begin with one result paragraph whose evidence you can fully trace.